Quotes

Look back over the past, with its changing empires that rose and fell, and you can foresee the future too.

— Marcus Aurelius

Followers

Search This Blog

Monday, December 6, 2010

HI hol Silver

Looks like silver is in final stages of a blow off top...(MAYBE !)


But looking at the monthly chart history seems to say that there will be better opportunities to go long silver...(LONGS look higher risk now)

When it turns it will be painful....for longs.  Timing a top on a parabolic move up is also tricky..!! 

Monday, November 8, 2010

Tuesday, October 5, 2010

FTSE near some tough resistance

FTSE rally hos now reached the down trend line from 2007 high best seen on weekly chart below:

FTSE WEEKLY
Also on the daily chart looks close to some strong horizontal resistance areas...is there a possible head and shoulders forming ?  ssshhhhh...

FTSE DAILY        


Seems like the probability is weighted in favour of a bear move from here, either the BIG one, OR (more likely IMHO) a move back into the rising channel with lower boundary at 5200 ish

CABLE...

Looks like cable is nearing significant resistance zone...

Could be one more move up to 1.65 if the USD carries on being sold..
Longer term view..MONTHLY Chart

has worked off the oversold condition at point 3 
RSI is now back to neutral level

IF wave count is correct longer term should revisit lows ie 1.30 level and possibly more

Monday, October 4, 2010

DAX breaking down from Diamond formation?

Looks like the Diamond Topping pattern is coming to fruition..with today's action (SO FAR!)
http://iberianviews.blogspot.com/2010/10/dax-diamond-formation.html
 6124 looks like temporary support, expect a possible retest of the breakdown level around 6200, if we get above 6230 ..back in the range and possible FAILURE of the DIAMOND.

If 6124 breaks , 6080/6060 level next support


LONGER TERM

 A break of 6060 brings 5850 into play...

Friday, October 1, 2010

DAX diamond formation?


"The diamond formation reversal pattern is found relatively infrequently. When it does form, however, it usually does so at market tops rather than at bottoms."

Wednesday, September 29, 2010

DAX topping or consolidation?

Dax has been in a range since Feb this year... UPPER BOUNDARY at 6360

 Could be an ascending triangle (bullish scenario) with a break above 6360 signalling new highs..OR could be part of a rising wedge (which if it breaks t the downside would be BEARISH).

Since we are near the TOP of the range got to be short here, looking for at least  a test of the lower boundary, or a decisive break lower (VERY BEARISH).

The weekly chart shows possible rising wedge, and the range bound formation, in relation to the all time highs

Tuesday, September 21, 2010

BACK.....

Kids BACK to school...

Wife BACK to work

BACK to looking at the markets...

Starting off with some LONG TERM charts...

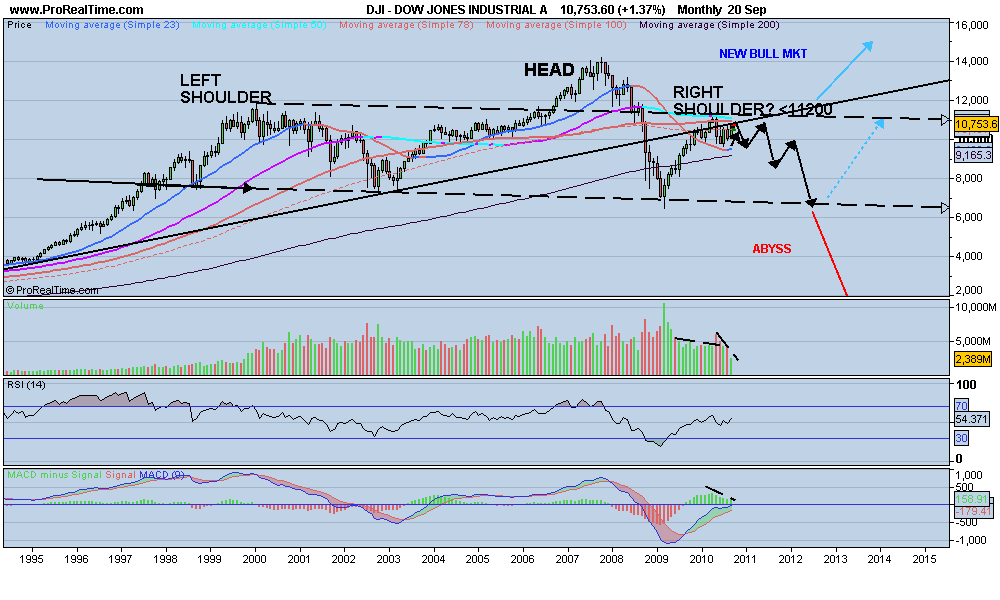
DOW JONES INDUSTRIAL ..The HEADLINE index (the one EVERY one watches, talks about etc)


The KEY level seems to be 11200 on the upside... 500 points away..
VOLUME doesn't SEEM to be confirming this move up.....

Many BEARS are DESPONDENT and some signs of CAPITULATION
Trading near the TOP of a channel..
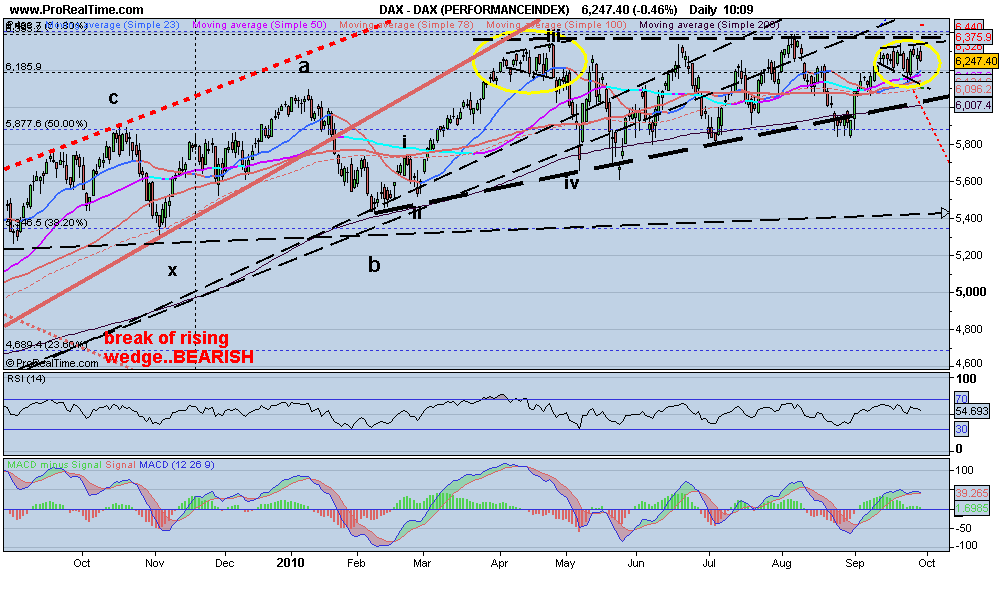
DAILY CHART

Shows proximity to the monthly channel
Looking extended short term..pullback then a final move up to test that channel?

DAX MONTHLY


Also nearing RESISTANCE best seen on  WEEKLY and DAILY charts..


DAX WEEKLY & DAILY CHARTS


Wednesday, August 11, 2010

NO CHANGE!!

Am on holiday, and there is no change for the markets in my view...

This previous post sums it up...click on it to see

A move above this years high delays the eventual process, but only delays.
 
DAX fractals still there...

 Am in the UK and the noise on the ground is not good...companes looking to reduce staff further, house prices stalling again...

Saturday, July 17, 2010


AUDUSD weekly..

Bear case..I like the 23 week ma moving below the 50 week ma ..just...waiting to see if we get a more decisive move down..or if this is consolidation for a move higher...

We could be forming a bear flag for the next move down in which case I expect a break of the "flash crash" lows around 80..

if we are in a bull run a move above 89/90 means new highs or at least a test of the old highs

Tuesday, July 13, 2010

FRACTALS

Looking at DAX weekly something caught my eye..maybe it's the heat!

The areas highlighted by rectangles look similar,,looks like one more thrust up to test resistance at 6340..then a pull back..one more test and ...F
                                             A
                                                 L
                                                    L


A break above 6340 (clear) means new highs probably due..

Thursday, July 1, 2010

USDJPY

Seems like YEN strength vs dollar = weak equity markets, so here's the USDJPY weekly..

Looks like tracing out a triangle, and a break below the lower line could tie in with a BIG fall in equity markets. May be that we stay in the range for a while longer, as it is a weekly chart...but more warning signs??

DOW very LONG TERM

Just trawling through charts, here's DOW Industrial with lines drawn from a while ago, the arrows are recently added...

EURO GBP short term bottom or near?

Haven't looked at EURGBP for a while (due to personal circumstances been out for a while), but we broke down through 0.8455, but we have hit the lower descending trend line at around 0.8100 and bounced.  This looks like could be key, though we are still in a DOWN TREND, may be a warning that EURO may have a period of strength vs Pound (which ties in with the previous post on cable).

Obviously a clear break below 0.81 and we could test as low as 0.78

CABLE

Recent rally "looks" like it could be ending, if so we could see 1.41 at a minimum over medium term.

Wednesday, June 30, 2010

DAX BIG head and shoulders still possible

Here's the chart from March 2010

and here is the one as of today...we are still in that large formation

A break through that red dashed line and all hell breaks loose , until then looks like we are still in that range 5600-6300 approx

BP

Will BP go bust?

Looking at the daily weekly and monthly charts..only the daily is showing some signs of a bottom (some positive divergence). Would be good to see it on the weekly and  monthly as well..one to keep an eye on.  Doubt it will go bust too many vested interests.. (40% of it's shareholders are based in the US, BP probably a large part of most pension funds, UK government will miss it's revenues...just a few)

Tuesday, May 25, 2010

DAX 3 hrs

Everybody starting to get bearish...am looking at 5500/5400 for support and possible LONG entry (if we get there)..alternatively selling 5750 may be the other trade to look for.  Looks like we are in a wave 5 down..so once finished could get a decent upward correction, or if really bullish a push to new highs..

Wednesday, May 19, 2010

DAX head n shoulders?

Looks like a H&S playing out..we have broken the neckline, now need some follow through target 5700..the daily chart shows a possible bullish scenario...


Gold weakness

Gold weaker today...WHY? Simply overbought so some profit taking...looking to buy it on weakness..especially if it gets to 1160 ish..

Target is still 1348 min..

Tuesday, May 18, 2010

Friday, May 14, 2010

EURO L O N G T E R M

Monthly chart of EURO  are we heading for 1.14?  Which also coincides roughly with 61.8 % retracement of the rally from November 2000...


Then it may be the turn of the US dollar to collapse....

Monday, May 10, 2010

DAX 30 mins


Short term look at DAX..expecting volatile few days or even couple of weeks after Thursday's rout in US indices.  Circles show areas of congestion..price at moment looks like breaking out but needs to be confirmed.

Tuesday, March 30, 2010

reflective time...

An aside from the markets..

Now we are coming up to summer ..(at least in S Spain) and the clouds are clearing ..thank God !!...we are finally getting to the task of clearing the land..and need to get the vegetables in the ground..

With the weird weather across Europe and especially down here..it seems that we are in store for higher food prices..some early vegetables have been wiped out by waterlogged conditions and only now is it possible to plant.  the problem being that the plantlets will not have the "good" i.e. not too hot temperatures for very long so roots will be less developed.  The "heat" will arrive soon, which means a lot of plants  will not have developed bug enough root systems to carry them through the summer, and once it heats up here the top 3 inches or so turn to rock!!


If you are interested in a Southern Spanish holiday home click here .


Thursday, March 11, 2010

Euro daily basing or consolidating?


Couple of possible scenarios.  For now looks like we will get a choppy rally up in  wave iv  before a wave v down..

IF the move down has finished we should see some good mini rallies to signal a change in trend

Monday, March 8, 2010

DAX daily

Whilst bullish sentiment is still rising..with the markets..the DAX seems to be lagging..

 We COULD be in the final move of an abc correction which when finished will herald a large move down..
The DAX has lagged other major indices, when usually it is LEADING the indices higher...

OF course all can change, but MAY be a WARNING against the decidedly bullish sentiment prevailing.

Wednesday, March 3, 2010

Why figures are meaningless!

 
Jobs figures are meaningless! As is most data from the govt or associated "independent" bodies. 

The figures today came out "better than expected"...BUT the fine print tells us that last month the data was WORSE than originally reported!

"There are three kinds of lies: lies, damned lies, and statistics." ..M Twain

DOW bull back..or pull back?

Looking at the rally from March 09 we can see 3 drives up.. a break of the up trend and now in a rally question is "Is this part of the correction of March 09 rally?"  OR  "is this the start of another leg up?"


BEAR CASE..
 

1.  We have 3 drives up, so would expect a "correction" at least
2. Current correction has not even retraced 23.6 % of the rally..normally would expect to at elast 38.2 % or 50 %.
3. Could be we have made an A  down, B up (currently), and next will be C down similar scenario to post here Dow Transport..clues


BULL CASE

1. retrace has been small so far..indicates "lack of selling"
2.  Close to making new highs for the current rally
3. Could be we have ALREADY made A B C correction...

EITHER way we should see resolution soon..maybe Friday NFP day (non farm payrolls)..

Dax  is still lagging FTSE and DOW

Thursday, February 25, 2010

EURGBP

Well this went further than I thought..BUT like the AUDUSD chart from 23/02/10 AUDUSD  the negative divergence set up is looking better with a new high and RSI flat.  And the STOP for a short is close by so RISK/REWARD  looks good as well.


GBPUSD looks like it is close to target so with Greece and other countries weighing on the €, maybe £ will start to outperform again vs Euro.

Wednesday, February 24, 2010

Dow Transport

Looking at this chart, it looks like the next big move should be down in equity indices, regardless of whether one is a BULL or a BEAR.

The weekly chart shows 5 clear thrusts up, a break of the uptrend. Then 1 move down, and at the moment in a rally.  If this is a correction of the March 09 rally, it seems too shallow, a 38,2 % or even a 50 % retrace would "look" better.  Then if it's a bull, a rally to new highs, if it's a bear we head  much lower..

Tuesday, February 23, 2010

AUDUSD

Trade on track..looks like the rally off the  7th Feb low has finished, tagged a 61.8% Fib level retrace at 9040, now at support 8879.  Looking for a re test of  broken trend line at 8960 ish for re short...


refer to previous posts correction ended or beginning and divergences continued..

if thi i next leg down...we could have a long way to go

AUDUSD

Stopped on initial position but re entered at higher level..the negative divergence looks better today ..a new recent high with RSI now turning down...plus on the 8hr chart below looks like we have a bearish reversal signal


Monday, February 22, 2010

Divergence continued..

Looking at AUDUSD again.. click for previous divergences post

AND NOW:


We can see RSI starting to turn down whilst price has more or less matched the previous high, setting up a NEGATIVE DIVERGENCE.  Short with a stop just above the recent high 9045, and look to cover half at the up trend line...a break of that and may see much lower levels.

Friday, February 19, 2010

Total Pageviews